

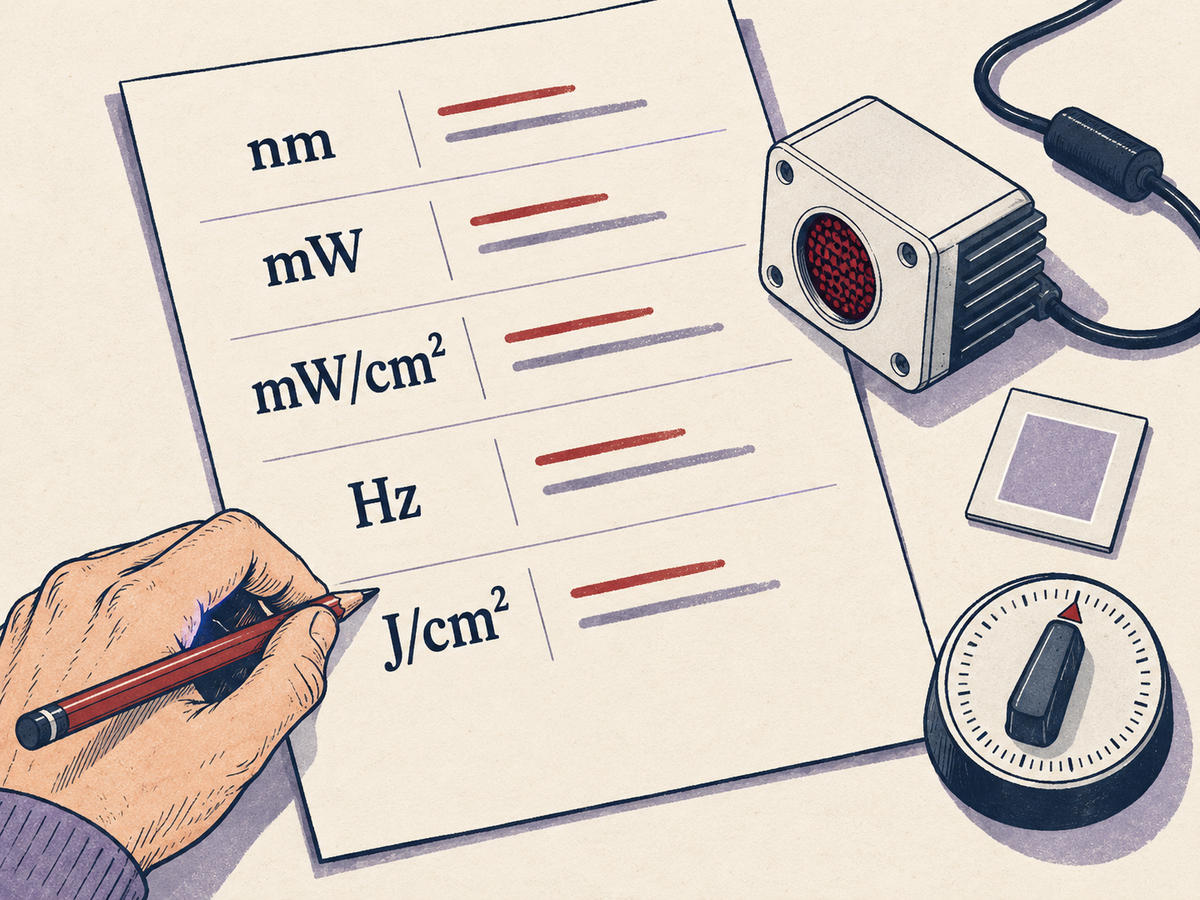
Browse photobiomodulation devices and you will quickly encounter numbers: nanometers, milliwatts, hertz, and joules. Each describes a different part of how light is delivered.
Reading those numbers together makes it easier to understand a device and compare its specifications with a research paper.

Start with what each number means
| Specification | What it describes | What to check |
|---|---|---|
| Wavelength, in nm | The wavelength of the emitted light | Whether the study and device use the same wavelength |
| Optical power, in mW or W | The rate at which light energy is emitted | Whether the value is optical output, and per module or total |
| Irradiance, in mW/cm² | Optical power incident per unit area | Where it was measured, and whether it is an average or peak value |
| Pulse frequency, in Hz | The number of pulses per second | Pulse duration or duty cycle, as well as frequency |
| Radiant exposure, in J/cm² | Incident light energy per unit area over time | Exposure duration and the irradiance used to calculate it |
Illuminated area, placement, and the number of sessions also help describe a complete protocol. Two systems can share a wavelength while delivering light in substantially different ways.

Time and irradiance work together
For constant irradiance at a specified surface, radiant exposure is irradiance multiplied by time.
As an illustrative calculation, 100mW/cm² is 0.1W/cm². Delivered continuously for 600 seconds, it gives 60J/cm² at that surface. This is an example of the units, not a recommended use protocol.
With pulsed light, the calculation requires time-averaged irradiance. Using peak output as though it were present throughout a session would overestimate the energy delivered. A frequency of 40Hz also does not, by itself, establish a higher average output than 10Hz; pulse timing and amplitude matter.
These calculations describe incident energy at the measurement surface. Estimating the light that reaches tissue beneath the scalp requires additional information about absorption, scattering, anatomy, and delivery geometry. An example of photon-transport research.
Why complete reporting matters in research
A 2026 review co-first-authored by Brainlume founder Jie Fu examined 42 human tPBM studies spanning healthy participants and clinical populations. The authors organized light-dose reporting across eight dimensions, including wavelength, power density, illuminated area, frequency, and energy per session and across a course of use.
They found that all eight dimensions could be directly reported or inferred in 16 of the 42 studies. Only three studies directly compared different dose groups. These findings highlight why a wavelength or a single energy value cannot tell the whole research story. Read the review.
Using this knowledge with Brainlume
Brainlume’s 810nm wavelength describes its light. Its 10Hz and 40Hz settings describe pulse repetition. Its preset 20-minute session describes duration. Each specification answers a separate question about the design.
Together with clearly reported optical output and measurement conditions, these details help readers understand what is being delivered. They also provide a basis for identifying which research protocols are most relevant to a device.
When comparing specifications, start with a practical question: “Are these values describing the same thing, measured in the same way?” That question is often more useful than choosing whichever number is largest.
See Brainlume’s design parameters.
References
Fu J, Gao Z, Jia H, et al. 经颅光生物调节干预阿尔茨海默病的临床研究进展 [Transcranial Photobiomodulation for Alzheimer’s Disease: A Systematic Review of Clinical Evidence]. Acta Laser Biology Sinica. 2026;35(2):149–161. Paper DOI.
Zhao C, Li Z, Ding Z, et al. Effect of Transcranial Light Stimulation on the Neurovascular Unit in the Human Brain. bioRxiv. Version posted April 26, 2025. Research preprint.
Share:
How Researchers Evaluate tPBM Safety
Why More Light Is Not Always Better